16 March 2019

An impressive display of group projects at Ramaiah University of Applied Sciences

February 2019 saw a rather impressive display of technology and knowledge by the full-time students of the 2017 batch of Ramaiah University of Applied Sciences.
I went to the exhibition at the Dwaraka auditorium expecting to see some simple projects by the technical teams, but was surprised to see the dental, MBA, pharma students, product design students and many more batches presenting their projects.

Here are some of them:

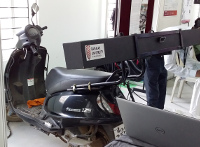
Meant to be a flying machine
Pothole counter using ultrasonic and image sensors

Wind tunnel to check forces on bridge


Building work completion tracker
Water filter

Component sorter

Another component sorter
A low energy EV motor (as I remember)


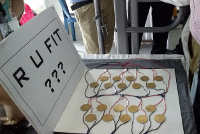
A blood glucose checker using IR

Helping satellites communicate using laser
Device that uses touch, sound and visual inputs to help people communicate with the visually impaired and the hearing impaired

Cricket player performance predictor based on past data
Software tool to select the best model for a particular algorithm, using residual errors

Convolutional Neural Network to identify scenery and concoct a story based on it
Some capabilities of the techno center

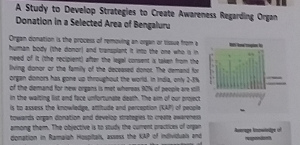
Study on organ donation awareness in Bangalore

IR robot to pick up difficult-to-locate dental tools fallen on floor


Assessment of impacted third molars

Restraining seat design for children
Good brushing habits teaching aid for visually impaired children

Study on leveraging e-commerce for farming

Skill India impact assessment

Study on effectiveness of water kiosks in Bangalore
 
Study on opportunities for the transgender population

An electric vehicle

Crowd structure interaction on pedestrian bridge

Modern design for an old bike model

Foldable stall design
Mechanized coconut husk remover

Automatic vehicle classification for highway monitoring
Blade guard to safely load and unload surgical scalpel

Directly compressible excepients for drug delivery
Mandibular retractor and fracture reduction forceps

Piezoelectric transducers to generate electricity from treadmill
Semi-automatic plastering machine
IoT based headcount monitoring system for buildings
Single row paddy reaper

 What was surprising was that projects were interdisciplinary. The dental students were creating robots, the civil engineering students were doing image processing, electronics students were using machine learning to assess models. The blade-guard innovator even applied for a patent.


01 February 2019

Dark themes galore!

Almost all applications have bright white backgrounds. Sure, it looks nice, but depending on ambient light, it can hurt the eyes a wee bit.

Image from AskUbuntu

Enter dark themes:

Dark themes for Chrome.
Dark themes for Firefox.
For Netbeans.

And very likely for any other application you want. You just have to search for "Dark themes for xyz".

I'm even changing the background of my blog to be a shade darker than the bright white it currently is.

ps: Before installing third-party themes and add-on's, it helps to check if they are safe to install. Just in case any of them are used for spying on your data.

13 January 2019

Curated blog posts

We are in this world to help each other, and what better place than the Internet for sharing knowledge. This page contains a curated list of interesting blog posts I've written which you may find useful.

Technical
Fun Projects  
How I used analytics to analyze real problems

Volunteering (CSR) 
Conferences and science meetups 

Artificial Intelligence


General How-to's

Good health


Say thank you or donate

06 January 2019

Removing metadata from photos


When you take a photo with modern digital cameras or your smartphone camera, there is a lot of information (EXIF data) that the device embeds into the photo that can be viewed in the image properties. When you share the photo with other people, if you don't want them to see that data, you can remove it with certain tools.

An internet search for "How to remove exif data from photo" will lead you to a lot of tools.


  • GIMP users: Just open the image in GIMP, choose "Export as" and when exporting the file, uncheck the "Save EXIF data" option.
  • Ubuntu users: Simply open a terminal in the folder that contains the images you want to remove exif data from and type  mogrify -strip *.jpg to remove exif data from all jpg files. Else instead of "*.jpg", specify the particular filename.


Unable to copy files from computer/laptop to phone SD Card / internal memory


It can be puzzling when you encounter an error that simply says that a file can't be copied from your computer to your phone.

It could simply be one of the following issues:
1. The filename has special characters like a comma or colon which is not supported by your phone's operating system as a filename.
2. The filename may be too long, and long filenames may not be supported by the phone's operating system.

Simply change the filename to something that contains just alphanumeric characters and you'll be able to copy it. 

03 January 2019

How to reduce the brightness of your monitor to lesser than what the operating system allows


Yet another reason to love Linux.
Sometimes you really need the brightness of your monitor to be lower than it already is, and I've found the best solution is to use xrandr. It's installed by default in Ubuntu.

First, you need to know which device is connected to your display (even if you are using a laptop).
Type:

xrandr -q


You'll get an output that looks something like this:

Screen 0: minimum 8 x 8, current 1366 x 768, maximum 32767 x 32767
DP1 connected primary 1366x768+0+0 (normal left inverted right x axis y axis) 256mm x 144mm
   1366x768      60.06*+
   1360x768      59.80    59.96 
   1280x720      60.00 
   1024x768      60.00 
   1024x576      60.00 
   960x540       60.00 
   800x600       60.32    56.25 
   864x486       60.00 
   640x480       59.94 
   720x405       60.00 
   680x384       60.00 
   640x360       60.00 
HDMI1 disconnected (normal left inverted right x axis y axis)
VGA1 disconnected (normal left inverted right x axis y axis)


Look for the one that says "connected", and use that in the next command.
Type:


xrandr --output DP1 --brightness 0.5


And tadaah!!! The brightness goes to 50% lesser than what it was.
Enjoy!!!


Create aliases

Still better, create these two aliases in ~/.bash_aliases.

alias br='xrandr --output eDP1 --brightness 0.5'
alias brightness='xrandr --output eDP1 --brightness '

Now you can just type br or brightness 0.3 or brightness 0.6 etc. instead of typing the entire command.


Update: Oct 2019: Redshift can be manually controlled and can even alter gamma. So rather than use xrandr, use Redshift: https://nrecursions.blogspot.com/2018/03/alternative-to-flux-for-ubuntu-is.html 
 
Update 2022: At least from Ubuntu 22.04 and Windows 10 onward, there's no need of installing redshift or similar apps, since the OS comes pre-installed with a NightLight app. Even Android has it.
 

30 December 2018

The silo-world of messaging apps


Messaging apps are convenient. Everybody agrees to that. It's easy to access notifications, easy to share files and it does not have the "formality" baggage that email comes with.

Yet, messaging apps have a fundamental flaw that services like email and SMS do not have: Universality.

With email and SMS, you can send messages between any service provider. However, you can't send messages between WhatsApp and Hangouts or WeChat or Telegram. A simple process of following a protocol like XMPP or creating a global standard that all messaging apps should have followed.

So now we are stuck in a world where we compulsorily have to install whatever app a group of people uses, even if we don't want to.

Indifference
 
Oddly, even though the objective of messaging apps is to bring people together, that does not necessarily happen.
One of my classmates got in touch with few other classmates after sixteen years, via phone and email. He took initiative to get in touch with more classmates, and with two months of effort, he put many other classmates in touch with each other. Everyone was happy about the reunion. They asked him to create a group on a messaging app and he told them he doesn't use that app. So they created the group themselves and all of them joined the group, leaving him out. They just didn't care if he wasn't part of the group. To them, it was his fault that he doesn't use the app. Needless to say, when I saw this cold response from everyone, I refused to join the group too.


What you can do

  • Tech identification: First, learn the science of identifying an appropriate communication medium. You can't use a messaging app to form a group of a diverse set of people, since many of them may not use apps. Use a more common medium like email. It's not convenience that matters here. It's uniform communication and participation.
  • Talk to people: Ask everyone what they are comfortable with. If somebody is not very tech-savvy or does not use the tech y'all chose, either check if everyone else is ok with using the tech this person proposes or offer to keep the person informed always. It's your responsibility to keep the group united.
  • Know the nature of communication: When there is an urgent piece of info to communicate, the ONLY reliable way to do it is to have a phone call. That's the only way you know the person has received the message. If you use email, SMS or a messaging app, don't assume that the other person has seen the message unless they respond with an "ok". Often, the response or read-receipt could be a result of somebody else looking at the message too. Do the phone call instead.

Hoping for an RFC that would be accepted universally. Messaging apps need the ability to talk to each other.


11 November 2018

Which is better? Octave or Matlab?

I'd say choose Matlab if you can. It's much faster than Octave.

Speed
A Sudoku program I developed used to take two minutes to run 2000 iterations in Matlab. The same program took 13 minutes to run 500 iterations in Octave.

The reason apparently, is because Matlab uses Intel's Math Kernel Library (MKL) internally, and I have personally seen the significant speed boost MKL gives, when I tried it for some of my C++ code I developed long ago.

GUI
Apart from this, there's the Matlab GUI which is far better than Octave in terms of customizability and plain-old user friendliness.


Granted, that Octave is being built by the open source community, but the community should have seriously considered the aspect of processing speed before starting the project. Even now it isn't impossible to make the switch to MKL. The speed changes I had seen in my C++ program were after I replaced the old code with function calls to MKL and it worked.

Good websites to download masters or PhD thesis / dissertation

To find a good university website or any other website where theses have been published and is available for free, your best bet is to first try using a search engine.

Eg: If you are looking for swarm intelligence using image segmentation, search with the terms:
"partial fulfillment" swarm image segmentation masters thesis pdf


Some other websites that can help are:


Update [June 2020]: On a side note, if researchers need to not only see the papers but also see the code, there's a website called Papers With Code.

08 November 2018

Aha!


Continued from the previous Aha!


Pachcha Malayalam
Share with this link


To be continued...


05 November 2018

A simple tutorial showing some basic PGMPy program code and explanations

Installation

Firstly, it's recommended you have the latest version of Python3 installed.
Python3 uses pip3 to install packages that you'll be importing into your programs, so ensure pip3 is installed too.
Install git.
I earlier preferred not to use Anaconda or miniconda due to version conflicts, unavailability of packages and dependency issues, but it's actually ok to use it. It's a good software. If any packages are missing, you can install them. This tutorial assumes you aren't using Anaconda.
 
Another option is to setup a virtual environment first, because different Python packages are dependent on different versions of each other and they can cause problems with the default Linux python, which will then lead to problems with the operating system. I've found this tutorial to be good for installing and using pyenv.
(Also have a look at Poetry)

Now install a bunch of peripheral packages (Not all of them are required. If you want to install just the bare-minimum, see the documentation here):
sudo pip3 install sphinx nose networkx numpy cython pandas setuptools IPython matplotlib pylab python-tk gensim spacy

Clone PGMPy and install:
git clone https://github.com/pgmpy/pgmpy 
git checkout dev
sudo python3 setup.py install


If you are wondering which IDE to use for Python, I've put up my own little review here. I earlier preferred LiClipse because my laptop had just 2GB RAM and LiClipse supports refactoring and autocomplete reasonably well. You could use PyCharm if you like. I now prefer VS Code (VS Code is also good enough for computers with low RAM or low processing power).
Also know about PythonAnywhere.


Tutorial

Try creating a basic Bayesian network like this:


from pgmpy.models import BayesianModel
import networkx as nx
import matplotlib.pyplot as plt

# Defining the model structure. We can define the network by just passing a list of edges.
model = BayesianModel([('D', 'G'), ('I', 'G')])
nx.draw(model, with_labels = True); 

plt.show()


If you encounter this error: "AttributeError: module 'matplotlib.pyplot' has no attribute 'ishold'", see this issue for the solution.


To add conditional probabilities to each of those nodes, you can do this:

from pgmpy.models import BayesianModel
from pgmpy.factors.discrete import TabularCPD
#import networkx as nx
#import matplotlib.pyplot as plt

# Defining the model structure. We can define the network by just passing a list of edges.
model = BayesianModel([('D', 'G'), ('I', 'G')])
#nx.draw(model, with_labels = True); plt.show()

# Defining individual CPDs.
cpd_d = TabularCPD(variable='D', variable_card=2, values=[[0.6, 0.4]])
cpd_i = TabularCPD(variable='I', variable_card=2, values=[[0.7, 0.3]])
cpd_g = TabularCPD(variable='G', variable_card=3,
                   values=[[0.3, 0.05, 0.9,  0.5],
                           [0.4, 0.25, 0.08, 0.3],
                           [0.3, 0.7,  0.02, 0.2]],
                  evidence=['I', 'D'],
                  evidence_card=[2, 2])
# Associating the CPDs with the network
model.add_cpds(cpd_d, cpd_i, cpd_g)
if model.check_model():
    print("Your network structure and CPD's are correctly defined. The probabilities in the columns sum to 1. Good job!")

print("Showing all the CPD's one by one")
for i in model.get_cpds():
    print(i)
print("You can also access them like this:")
c = model.get_cpds()
print(c[0])
print(model.get_cpds('G'))
print("Number of values G can take on. The cardinality of G is:")
print(model.get_cardinality('G'))


Output CPD tables:


Here, the "variable_card" isn't about a "card". It's the cardinality of the variable. Same with evidence_card.
Have a look at the CPD tables and you'll see that variable cardinality for G is 3 because you want to specify three types of states for G. There's G_0, G_1 and G_2. For the variable cardinality and evidence cardinality, I feel the creators of PGMPy could've programmed it to automatically detect the number of rows instead of expecting us to specify the cardinality.

So variable cardinality will specify the number of rows of a CPD table and evidence cardinality will specify the columns. Once you've specified the CPD's, you can add it to the network and you are ready to start doing inferences.


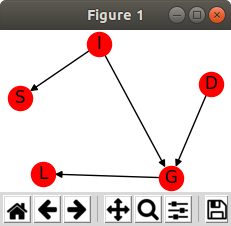
Try a slightly larger network


from pgmpy.models import BayesianModel
from pgmpy.factors.discrete import TabularCPD
from pgmpy.inference import VariableElimination
import networkx as nx
import matplotlib.pyplot as plt

# Defining the model structure. We can define the network by just passing a list of edges.
model = BayesianModel([('D', 'G'), ('I', 'G'), ('G', 'L'), ('I', 'S')])

# Defining individual CPDs.
cpd_d = TabularCPD(variable='D', variable_card=2, values=[[0.6, 0.4]])
cpd_i = TabularCPD(variable='I', variable_card=2, values=[[0.7, 0.3]])
cpd_g = TabularCPD(variable='G', variable_card=3,
                   values=[[0.3, 0.05, 0.9,  0.5],
                           [0.4, 0.25, 0.08, 0.3],
                           [0.3, 0.7,  0.02, 0.2]],
                  evidence=['I', 'D'],
                  evidence_card=[2, 2])

cpd_l = TabularCPD(variable='L', variable_card=2,
                   values=[[0.1, 0.4, 0.99],
                           [0.9, 0.6, 0.01]],
                   evidence=['G'],
                   evidence_card=[3])

cpd_s = TabularCPD(variable='S', variable_card=2,
                   values=[[0.95, 0.2],
                           [0.05, 0.8]],
                   evidence=['I'],
                   evidence_card=[2])

# Associating the CPDs with the network
model.add_cpds(cpd_d, cpd_i, cpd_g, cpd_l, cpd_s)
# Getting the local independencies of a variable.
print("Local independencies of G:")
print(model.local_independencies('G'))
# Getting all the local independencies in the network
print("Local independencies of other nodes:")
model.local_independencies(['D', 'I', 'S', 'G', 'L'])
# Active trail: For any two variables A and B in a network if any change in A influences the values of B then we say that there is an active trail between A and B.
# In pgmpy active_trail_nodes gives a set of nodes which are affected by any change in the node passed in the argument.
print("Active trail for D:")
print(model.active_trail_nodes('D'))
print("Active trail for D when G is observed:")
print(model.active_trail_nodes('D', observed='G'))

infer = VariableElimination(model)
print('Variable Elimination:')
print(infer.query(['G']) ['G'])
print(infer.query(['G'], evidence={'D': 0, 'I': 1}) ['G'])
print(infer.map_query(['G']))
print(infer.map_query(['G'], evidence={'D': 0, 'I': 1}))
print(infer.map_query(['G'], evidence={'D': 1, 'I': 0, 'L': 0, 'S': 0}))

nx.draw(model, with_labels = True); plt.show()


What is going on in the code:

The variable elimination queries are pretty-much self-explanatory, where you are querying for the state of a node, given that some other nodes are in certain other states (the evidence or observed variables). Inference is done via standard variable elimination or via a MAP query. PGMPy also allows you to do variable elimination by specifying the order in which you want to eliminate variables. There's more info about this in their documentation.
What the line infer.query(['G']) ['G'] means is that it returns a Python dict (which is like a multimap) and then queries the key in that dict to get the value corresponding to that key (see the code below). The output looks like this:

{'G': 0}


Here, 'G' is the key of the dict, and to access the value associated with 'G' (which is zero in this case), you just have to use ['G']. So it is the equivalent of doing:

q = infer.query(['G']) 
print(q['G'])


Why this tutorial 
 
For anyone new to Python or PGMPy, a lot of this syntax looks very confusing, and the documentation does not explain it deeply enough either. The objective of this tutorial was to clear up those basic doubts so that you could navigate the rest of the library on your own. Hope it helped.

PGMPy is created by Indians, and is quite a good library for Probabilistic Graphical models in Python. You'll also find libraries for Java, C++, R, Matlab etcetera. If you want to manually try out your network model, there is an excellent tool called SAMIAM.

More documentation for PGMPy is here, and if you want their e-book, an internet search will lead you to it.


Say thank you or donate

16 October 2018

Installing Netbeans 8.2 on Ubuntu 16.04 or 18.04 for Python functionality

Most Python editors are either not very functional or they take up way too much memory or they are just a pain to install. If you want a simple editor for Python, try Geany. Note that if you use Python 3, you'll have to specify it in Geany's compile and execute commands.

If you are a Netbeans fan, you'll need Java 8 to be able to install Netbeans.

You could either choose to install from this PPA:
sudo add-apt-repository ppa:webupd8team/java
sudo apt-get update
sudo apt-get install oracle-java8-installer

Or install from the default JDK:
sudo apt-get install openjdk-8*
 
Now open the environment file:
sudo vi /etc/environment

Add the following line to the environment file (for Netbeans to be able to find Java):
JAVA_HOME="/usr/lib/jvm/java-8-oracle"

Save and exit.

source /etc/environment
echo $JAVA_HOME

Now download the Python plugin for Netbeans 8.2. You'll get a zip file. Extract it and open Netbeans.
Goto the Tools > Plugins menu option. 
Select the "Downloaded" tab.
Click "Add Plugins".
Select the folder that you just extracted from the zip file and you'll see many ".nbm" files.
Press Ctrl+A to select all of them and press "Ok".
Click the "Install" button on the bottom left corner. Accept the license terms and click "Install".
Restart Netbeans.

Select File > New Project > Python > Python Project.
You'll see a "Manage" button which you can use to change the python platform to Python 3 if you need to.

Click the "New" button, navigate to /usr/bin/ and you'll find a "python3" file among a lot of files. Select it and click "Ok".
Now select Python 3 and click "Make Default".
Click "Close".
Click "Finish".


That's it! Your Python 3 project is ready to run in Ubuntu with Netbeans.

A better tutorial on the Haar features used in Viola Jones algorithm

One of the most confusing aspects of the Haar features used for the Viola Jones algorithm is the black and white rectangles. It took quite a while for me to figure it out since neither the research paper of Viola and Jones explained it well nor did any of the tutorials. Besides, the concept shouldn't be shown as filled black and white rectangles in the first place. So here's a change:

Instead of showing Haar features like this:

Show them like this:


It is necessary that people intuitively understand that it is not the black and white rectangles that are important, but the actual pixel values within the rectangles that are important. For good contrast, show them as yellow and red rectangles if you like.

Source of the original images: University of Oulu's website.


Why are we using those rectangles?

If you were searching for a line in an image, you'd use a mask that's shaped like a line. Same way, when we search for a face, we can use a mask that is shaped like a face or to reduce computation, we could just search for parts of the face that almost always have dark and bright pixels in a certain pattern. The eyes and forehead are one such example. The pixels at the eyes will almost always be dark and the pixels at the forehead will almost always be brighter than the pixels at the eyes. So the black rectangle in the figure above just says that we are looking for a rectangular region where most of the pixels will be dark. The white rectangle above it means that wherever we intend to find such dark pixels (eyes area), we want to be sure that the rectangular area directly above it should compulsorily have plenty of bright pixels (the forehead area).

Of course there would be plenty of other places in the picture which would have similar bright and dark areas, but the area which is most likely to be the eyes and forehead, will give the highest Haar value (calculated in the formula below). This is also why you should not only search for the eyes and forehead, but also search for the nose and lips and ensure that the features you found are in the correct positions with respect to each other. That's how you'll be able to ensure that you have located a face. So based on what kind of black and white pixel pattern you are searching for, you have to design your Haar feature (the black and white rectangles) in such a way that it results in the highest value for whatever feature you are searching.


How to do the calculations?

Start by normalizing pixel values. If you have your grayscale image pixel values in a 2D matrix M that can hold grayscale values from 0 to 255, then divide all values in the matrix by 255 to normalize them. M will now have values ranging from 0 to 1.

Haar value = ((sum of values within white rectangle area in M) divided by (number of pixels within white rectangle)) minus ((sum of values within black rectangle area in M) divided by (number of pixels within black rectangle)).

The closer the Haar value is to 1, the more likely it is, that you've found a facial feature you were trying to match. In the image above, we were trying to find areas where the darker pixels of the eye region have an area above them consisting of lighter pixels of the forehead.


Other Haar feature shapes

Don't worry when you see shapes like this:


It's the same concept. Simply take the sum of all pixels from both white areas in the normalized image matrix M and the sum of all pixels from both black areas in M and subtract in the same way we did earlier. This particular shape is to detect some dark diagonal feature. You can also create your own Haar feature shapes based on what facial feature you are trying to detect.


To learn more about Integral images and Haar features, I recommend Balazs Holczer's tutorials. Well explained, and it's pleasantly amusing to hear him say "Lots of lots of" and the way he says "Feeeeeatures" :-)


Integral images


Haar features


Say thank you or donate

14 October 2018

Skills requred in the field of Machine Learning and Data Science

While doing a literature survey for an assignment, I came across this Medium post by Jeff Hale where he lists some of the skills and technologies that are most in demand during 2017 and 2018 for jobs in Machine Learning.


What a job-seeker should know is that it isn't the highest bar in the graph they should be looking out for. These graphs only show you what the industry wants. There are many job descriptions that list an array of skills but the recruit is actually made to work on something much more mundane like data cleaning or preparing presentations.

It's far more important to identify which area of Machine Learning interests you. Do your own little research or build hobby projects specific to that area of interest and see if you can integrate it with other Machine Learning paradigms.
When you look for a job, don't just look for the skill-set they require or the projects they work on. Look for what your role would be in the project and have a very careful look at the Glassdoor reviews and Indeed reviews about the company culture. During the interview, make sure you get to meet the actual people who would be supervising you and if possible, even the team you'd be working with. Past experiences have shown that the way you are treated before, during and after the interview are a very good indicator of how you'll be treated after you join the company. You can even identify potentially toxic people you'd want to avoid.

Machine Learning and Data Science technologies are here to stay. If you've got yourself equipped with the necessary basic skills, you won't find yourself struggling to land yourself a job. What you do have to worry about is whether you end up as just a soldier in an army of data gorillas or whether you build products that you enjoy building, do research that is fulfilling and make the world a better place for everyone.